
I have been digging into the Phase 2 48-week efficacy estimand (24.2%) and the company-reported Phase 3 up to 28.7%. Those are not head-to-head; different populations, baseline BMI, duration, estimand, maybe follow-up. I am not making a claim, just trying to map the gap. If you have read the CTgov entries, which variable matters most: trial length, baseline weight, the Chinese cohort in NCT05548231, the knee OA trial, the postmenopausal subgroup, or the glucagon arm? Also curious how the 1946 and 2335 enrollment numbers shift power.
24.2% Phase 2 vs 28.7% Phase 3: What Explains the Gap?
 #1
#1
 #2
#2
The 24.2% was efficacy estimand, not treatment policy. That alone can explain a few points depending on discontinuations.
 #3
#3
Duration's the other one people gloss over. 48 weeks in Phase 2 vs the longer Phase 3 windows — and in both cases weight loss probably hadn't plateaued yet. Worth keeping in mind before comparing the numbers side by side.
 #4
#4
Everyone compares company PR to peer-reviewed Phase 2 like it is apples to apples. It is not. Wait for full Phase 3 tables.
👍 1
❤️ 1
 #5
#5
I printed the CTgov pages and taped them above my desk. The estimand row alone made me pause. Treatment policy versus efficacy can look like two different studies, even when the visits line up.
#6
Short version: not head-to-head. I keep saying this. Different baseline BMI, different weeks, different analysis sets. The gap is a pile of small things, not one villain.
 #7
#7
What jumped out at me isn't duration, it's how many people were still in the study at the readout. The earlier one had a chunk of early discontinuations, and if those folks get excluded from the efficacy estimand, the group left over is basically the people who tolerate it best — that's a survivorship number, not a population number. Phase 3 kept more people on board, so its mean drags less. Check the completion rates side by side.
 #8
#8
Baseline weight does a lot of quiet work here. Losing 40 lbs from 220 is 18%; losing 55 from 265 is 21% — same drug, same effort, different denominator. If Phase 3 enrolled heavier, some of that 4.5-point gap is arithmetic, not biology. I'd want mean starting BMI for both before crediting anything else, and honestly the median might tell you more than the mean.
 #9
#9
I keep circling back to NCT0554823 and whether anyone split the results by region. East Asian cohorts often start at lower BMI but carry more visceral fat at that same BMI, so a percent-of-bodyweight endpoint can undersell what's happening at the waist. Did that trial report waist circumference, or just scale weight? If it's scae only, then 24.2 versus 28.7 is two different measurements pretending to be one.
👍 1
 #10
#10
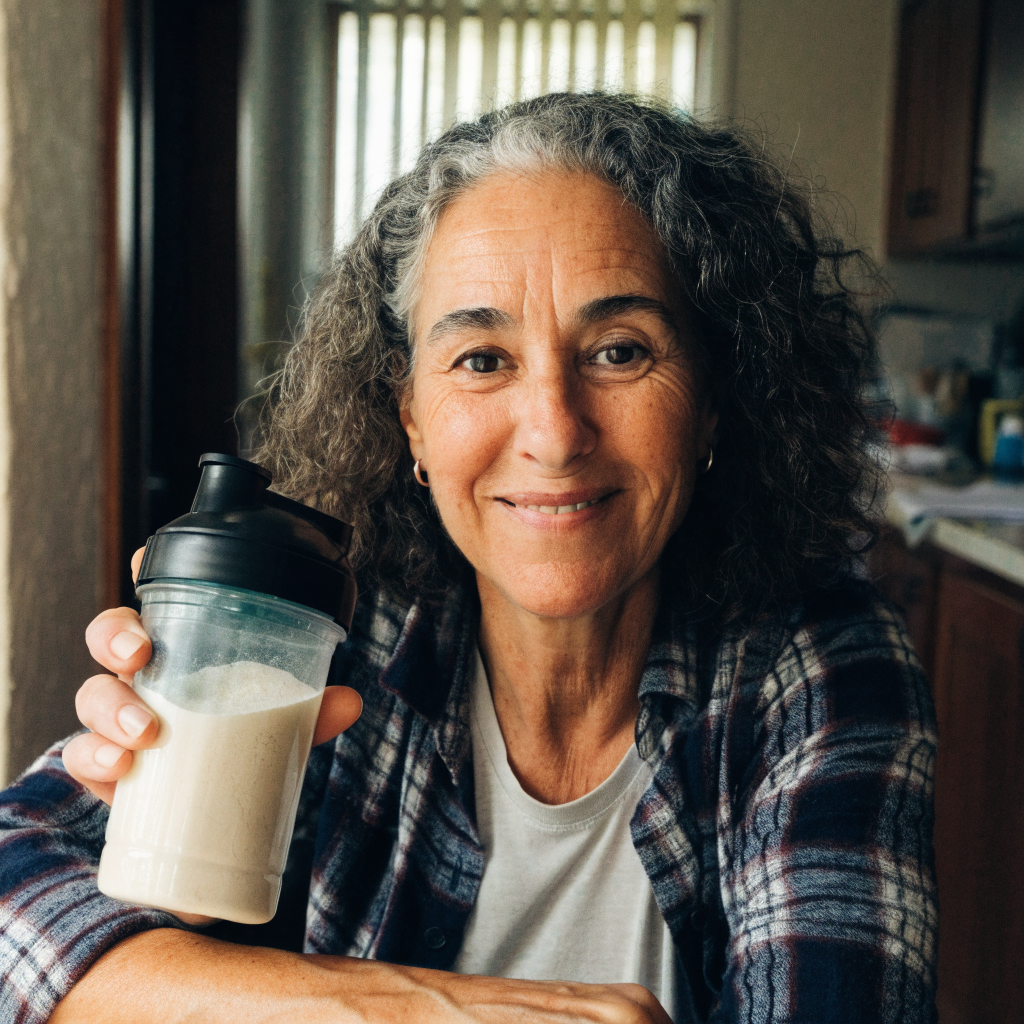
Personal thing that made me stop trusting the duration argument: the body-comp numbers in my tracker — down about 9% over the first 16 weeks, flat from roughly week 18 to 30, then another 6% between months 8 and 11. Best stretch was the back half, and nothing changed except finally tracking protein (aiming 130g) and walking 8k steps with a podcast. The intervention didn’t get stronger; the habits just showed up late. So if Phase 3 ran longer, the extra time may not be harvesting more drug effect, it may be giving behavior change room to compound. Still, does Phase 3 publish a week-48 snapshot of that same cohort? Hold duration constant and whatever’s left is population.
 #11
#11
My week 12 plateau hit exactly when I changed my Saturday routine, so I stopped trusting single weigh-ins and switched to 7-day medians. In my logs, a salty Sunday can swing me 2.3 lbs by Monday and 0.8 by Wednesday. If a trial endpoint is one visit, that noise could move a group mean by a point or two, especially with small arms. I’m not trying to explain the whole 4.5-point gap, but endpoint timing and who shows up that day might do quiet work. Weird part: during a 3-week scale stall my waist dropped 1.5 inches, so the tape kept me sane. Has anyone else compared their weekly average to the clinic weigh-in and seen a different story?
👍 1
#12
Sleep was my hidden variable. I traced 6.5 vs 7.5 hours for 8 weeks; under 6.5 I averaged 0.2 lb/week lost, at 7+ I averaged 1.1 lb/week, same meals and walks. The surprise was that a bedtime alarm did more than adding a 45-minute gym session. I know it’s n=1, but if one arm sleeps worse, the percentage gap gets weird fast.
 #13
#13
My jeans size is the only metric that hasn’t lied to me since week 6.
👍 1
#14
Weekends are my personal Phase 3: same plan, two dinners out, completely different graph.
 #15
#15
The gap I keep landing on isn't trial length, it's how adherence gets counted. My own 48-week log looked like 24% down by week 24, then only added about 4% by week 48 because I quit tracking dinners. If Phase 3 had more visits or completers, that alone could add a few points. Did the CTgov entries list discontinuation rates by arm?
👍 1
 #16
#16
Baseline BMI is the sneaky one. I started at 41 BMI and dropped 10% in 12 weeks; a friend started at 31 and lost 6% in the same window. Higher starting weight can inflate early percentages without meaning the trial was longer or the population was that different. Do the CTgov entries show mean baseline BMI? That would move my needle more than country.
👍 1
#17
My scale swings 4 lbs on pizza night, so I trut monthly averages.
#18
I’d bet on the estimand switch, not the Chinese cohort.
#19
Week 40, down three belt notches, scale says 11 pounds. Phase percentages never fit one actual body anyway.
👍 1
#20
Sleep is my hidden variable, and I got it backwards for months. Same food, same walking, but a 5-hour night versus 8 hours swings my morning number 2-3 pounds and my next-day hunger is a different animal. Weeks 1-20 I slept well and dropped steadily; weeks 21-30 both kids had croup and everything flattened. I blamed my food. It was the sleep. A tidy trial week isn't my February.
👍 1
❤️ 1
#21
Started walking 25 minutes after dinner, six nights a week. Weeks 12 to 18 my waist finally moved after a month of nothing.
👍 1
#22
Weekends are my gap: careful weekdays, then Saturday brunch undoes four days. Every trial average hides that math.
👍 3
#23
The variable I’d bet on is how each trial handled people who stopped treatment, not just length or baseline BMI. Phase 3 retention tends to be higher, and if the estimand counts on-treatment or imputes completers differently, 4-5 points can appear from that alone. I’ve seen it in my own 48-week chart: my last 8 weeks of data changed the average way more than the first 8.
👍 2
#24
I track waist via a pair of old 34 jeans, not the scale. Weirdly, they got loose during a 6-week scale stall. That tells me a Phase 2 vs 3 efficacy gap can be mostly measurement noise and water, not true fat loss difference. My scale moved 1.2 lb that month; jeans moved one belt notch.
👍 2
 #25
#25
248 down to 203 in about 11 months, so 18% — and here's the reversal: my percentage looks worse than my actual body change suggests, because percentage-of-body-weight math flatters heavier starting points, and I suspect that's a chunk of your gap. A friend in the same clinic program started at 190 and lost 25 lb, only 13%, but her waist went from 36 to 31 inches and she visibly changed more than I did off a bigger percentage. So if the Phase 3 population ran heavier at baseline than the Phase 2 one, you'd get a higher % on paper for the same real-world difference, before anyone even touches trial duration. On duration, my own rate went from roughly 1.5 lb a week in months 2 through 5 down to about 0.3 lb a week by month 9, which means any longer trial is basically buying the last few percent at a discount — cut me at 48 weeks versus 68 and you'd manufacture a gap that's just the calendar, not the drug. I'd look at baseline BMI and how many people were still contributing data at the final visit before I'd credit the estimand with much.
👍 4
 #26
#26
Something nobody's raised yet: run-in period. If Phase 2 had a longer lead-in, or used the food log as a gate before randomization, you've already screened out the people who couldn't keep the routine, and that shifts the estimand regardless of what the drug itself did. Did either CTgov listing show a run-in or washout arm? The other thing I'd want broken out is free-sample access during the trial, since that's a very different real-world test than somebody packing their own lunch. I walk a rural route five days a week, so my portion-control fight is the deli case at the gas station and whatever people leave in the mailbox, and my tracking only got honest once I started counting the bites I took standing at the
👍 4
#27
i’ve done the lose-regain dance, so I’m weirdly obsessed with these gaps. The variable I’d poke at first isn’t just length—it’s visit frequency and analysis population. Phase 3 protocols often have more scheduled contact, and if 28.7% is completers/on-treatment while 24.2% is a stricter estimand, that alone can explain a chunk. Do you know if the CTgov Phase 3 entry lists a different primary analysis population, or if there was a longer run-in? Those two things would move my bet more than baseline BMI.
👍 3
❤️ 1
#28
Honestly, Hi, brand-new here and only on week one, so I’m mostly lurking. One thing I haven’t seen yet: whether Phase 3 had a more standardized lifestyle/behavioral component (dietitian visits, food logs, activity goals) than Phase 2. I’ve been tracking my own meals and weekly weigh-ins, and even tiny changes in how often I check in make me more consistent. If Phase 3 had more touchpoints, could that alone inflate the % vs Phase 2? Not a claim, just trying to map it. Did the CTgov entries list anything like that under “behavioral” or “other” interventions?
👍 6
#29
One angle I haven’t seen: site/visit intensity and food environment. I run a cafe, so my biggest leak is tasting spoons and day-old pastry—environment matters. If Phase 2 was smaller or more academic, folks may have had more frequent check-ins, food logs, or dietitian touchpoints, which can shift results by a few points without any medication difference. Did the Phase 2 protocol standardize lifestyle support, and what were completion rates? That’s the variable I’d bet on before duration/estimand. Also curious whether Phase 3 was more geographically spread, because different food cultures could widen the gap.
👍 4
❤️ 1
#30
One variable I haven’t seen flagged: diabetes status. In a lot of GLP-1 programs, people with T2D tend to lose a smaller % than those without, and if Phase 2 had a bigger diabetes subgroup, that alone could shave a few points off the 24.2%. Phase 3 often leans more “obesity only.” Not saying it’s the whole gap, but worth checking baseline A1c/T2D proportion. I’m usually juggling airport food and hotel scales, so I know one weird week can skew my tracking—but trial-level differences in diabetes mix seem like a cleaner explanation than my sodium blip.
👍 5
❤️ 1
#31
I keep coming back to baseline metabolic health beyond diabetes status. In my own tracking, weekly averages moved much more when my sleep and stress were steady than when I tried to manage food choices alone. Trial-wise, I’d want to know whether Phase 2 and Phase 3 differed in baseline HbA1c, blood pressure, or use of other weight-affecting medications. Those can shift both appetite and retention, which would make the percentage look different even if the medication effect were similar. Did the CTgov entries report those baseline characteristics, or only BMI and diabetes status? That might be a cleaner place to look than trial length alone.
👍 8
❤️ 1
#32
New variable: sex/menopausal status. If Phase 2 skewed younger women and Phase 3 skewed older/post-menopausal, that alone could move the average. I’m a dorm student doing cheap-protein Olympics (current medalist: tuna packet), so my tracking is mostly “did I avoid the 2 a.m. vending machine?” But for the gap, I’d want subgroup tables by sex and age, not just overall means. Has anyone found those in the CTgov results, or are they hidden in supplement purgatory?
👍 8
❤️ 3
#33
One thing I’d check before blaming baseline BMI: the intercurrent-event strategy. Phase 2 “efficacy estimand” can use a hypothetical strategy that excludes people who add other weight-loss meds or surgery, while a Phase 3 “up to” figure is sometimes on-treatment/completers. Those aren’t the same denominator. Do the SAPs spell out how they handle discontinuation and rescue? I’ve seen a few points of difference just from that. If someone has links to both SAPs, I’d read them.
👍 8
❤️ 3
#34
New angle: sex/menopause status and baseline lean mass. Those can shift how much total weight comes off even with similar adherence. I track sleep, protein, and strength sessions, and my loss is way steadier when those are consistent—total n=1, I know. If Phase 2 had more perimenopausal/menopausal women or lower baseline lean mass, that could account for part of the 4.5-point gap. Does anyone know if the CTgov entries report sex, menopause status, or body-composition substudies? That’s the variable I’d want before blaming trial length.
👍 2
#35
Another cafe owner here—portion creep is my daily boss. One thing I’d add: Phase 2 often has a stricter run-in/enrichment phase, so early non-tolerators or non-responders get screened out before the main efficacy window. Phase 3 tends to be broader and keeps more people in the analysis even if they stop. That can swing the percentage without the medication behaving differently. I’d check CTgov for run-in design and whether there’s a sensitivity analysis for early discontinuers. Did either phase report that? That’s the variable I’d want to see.
👍 6
❤️ 2
#36
i’d throw run-in design into the mix. If the Phase 3 had a longer lifestyle run-in before the efficacy clock started, it would filter out early dropouts and people who never really changed eating, which can make the averae look better without any difference in the drug itself. Does the CTgov entry spell out a run-in or washout? I couldn’t find it. I’m on a stubborn 10-week plateau myself, so I’m suspicious of every tidy explanation.
👍 9
#37
Long-timer here. One variable I haven’t seen mentioned: prior weight-management medication exposure and washout length. In earlier threads we saw how even a handful of prior users can drag early response, and Phase 2/3 often handle that differently. Also, Phase 3 tends to have more sites with structured diet/exercise counseling; that’s not nothing over 48+ weeks. If you’re mapping the gap, I’d ask whether the Phase 2 protocol allowed more prior meds or had a shorter washout. That could matter more than trial length once you’re past 48 weeks. Curious if the CTgov history shows that.
👍 4
#38
I’d add contact frequency and visit schedule. Phase 3 often has more weigh-ins/log prompts, and that’s my personal lever: the snack drawer stays closed when I know I’m logging it. Did the CTgov entries list visit frequency? If Phase 2 had fewer touchpoints, that could explain part of the gap without any weird math. With two kids and chaotic 6pm dinners, accountability is the thing that moves my own numbers more than almost anything.
👍 1
❤️ 1
#39
i’d also pull the placebo-arm weight change and completion/discontinuation curves. In the trials, a big chunk of these gaps is often placebo response plus differential dropout, not duration alone. If Phase 2 placebo lost more (fewer sites, more frequent visits?) and Phase 3 had more early discontinuations carried via the estimand, that can explain several points. I track my own weekly weights and the first 8–12 weeks are noisy enough that imputation choices matter. Sharp follow-up: do the CTgov entries list planned vs actual completion rates by arm? That’s where I’d look first.
👍 10
❤️ 2
#40
Run-in and visit cadence. If Phase 2 had a single-blind placebo run-in and Phase 3 didn’t, you’ve already selected for adherence before baseline—that’s a few free points. Same with weigh-in frequency: weekly scale checks are basically an intervention. I’d map those two before blaming biology. Do the CTgov entries list retention by visit? That’s usually where the gap hides.
👍 3
#41
Fellow plateau prisoner here. One variable I haven’t seen mentioned: whether Phase 2 kept a stricter cap on alcohol/restaurant meals or required food logging throughout, versus Phase 3 only during the run-in. In my own tracking, my deficit disappeared not from big binges but from unlogged cooking oils and “tastes” while cooking—maybe 200–300 kcal/day, enough to stall me for weeks. If Phase 3 had more dietitian touchpoints or app adherence, that could widen the gap without any biology difference. Did either CTgov entry list adherence to logging/steps as a secondary outcome? That’s what I’d check before blaming baseline lean mass.
👍 9
❤️ 1
#42
My bet is missing-data mechanics, not biology. If Phase 3 had more sites and more early dropouts, the denominator shifts fast. I track weekly weight and waist; a three-week logging gap makes my own 12-week trend look like a different trial. Do the CTgov entries show discontinuation rates by arm and exactly how post-discontinuation weights were handled? That’s the lever I’d pull before blaming baseline lean mass or run-in.
👍 2
#43
That gap may partly come down to how weight was measured. If Phase 2 used clinic visits at varying times or with clothing, while Phase 3 required standardized morning fasted weights on calibrated scales, small differences can add up over 48–72 weeks. I track weekly averages, and switching from random weigh-ins to a consistent morning routine removed about 1–2 lb of noise from my own trend. Do the CTgov entries say whether the Phase 3 protocol mandated a specific weigh-in procedure? That seems like a quieter lever than duration or population.
👍 3
#44
One thing I’d chase: how each trial handled off-treatment/rescue data. If Phase 2 used a while-on-treatment estimand and Phase 3 used treatment-policy (or the reverse), you can get a several-point gap with zero biological difference. Same way my plateau looks totally different if I count only weeks I’m consistent vs. all 7 days — the denominator does the work. Do the CTgov entries spell out the exact estimand and whether rescue was censored or included? That’s the first thing I’d map before baseline BMI, sex, or run-in.
👍 3
❤️ 1
#45
One thing I haven’t seen mentioned: visit schedule and data cut. Phase 2 often has more frequent, protocol-mandated weigh-ins, which can nudge adherence and water/sodium behavior. Phase 3 might use broader windows or site-reported weights, and if the 28.7% is a snapshot at a later data cut vs Phase 2’s fixed 48-week estimand, you’re comparing different time points. I’d also check whether rescue/discontinuation weights were included and how many people had treatment interruptions. In my own log, a 2-week interruption shows up as 1–2% scale noise. Which matters more to you: visit density or data-cut timing?
👍 4
❤️ 1
#46
I’ve been white-knuckling a plateau since March, and the only thing that moves my numbers is accountability frequency. When I check in with a dietitian every 2 weeks, my portions stay
👍 3
#47
One thing I’d want to see in the baseline table: diabetes/prediabetes status. Weight-loss response tends to be lower in folks with T2D, and even a modest imbalance in A1c or diabetes prevalence can shift a trial mean by a few points. CTgov often just says “obesity,” but the supplement’s baseline characteristics usually reveal whether one trial had more impaired glucose metabolism. If Phase 3 excluded T2D or enrolled more prediabetes-only participants, that alone could explain part of the gap. Do the CTgov entries or supplements report baseline A1c and diabetes meds? That’s the first comparison I’d make.
👍 3
Login to reply to this thread.
Login / Sign up